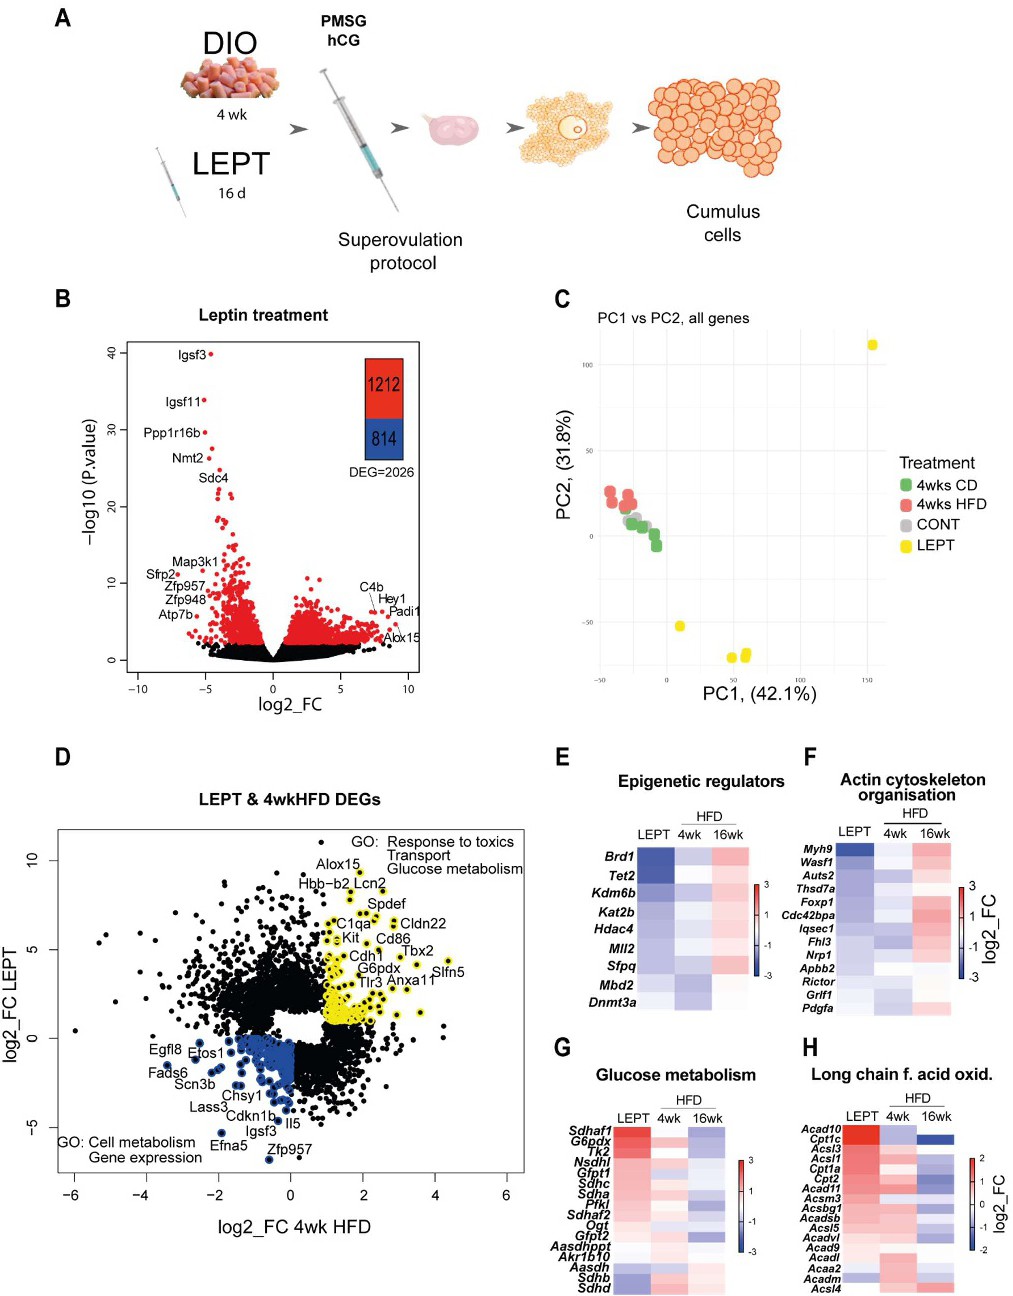
Fig. 4. Pharmacologically hyperleptinemic mouse model shows leptin effects in the transcriptome of cumulus cells during early obesity. (A) Experimental design: mice were fed chow diet (CD) of high fat diet (HFD) for 4 weeks (wk) (4 wk DIO) or injected with saline (CONT) or 100 µg of leptin (LEPT) for 16 days, followed by superovulation and collection of cumulus cells from cumulus-oophorus-complexes. RNA-seq analysis of gene expression in cumulus cells. N=3-7 mice per group. (B) Volcano plots showing distribution of differentially expressed genes in LEPT group; genes with False Discovery Rate <0.05 coloured red. (C) Principal component analysis of global transcriptome shows LEPT effect is the main source of variance in the data (first principal component, PC1). DESeq2 analysis of transcriptome data in cumulus cells. (D) Scatter plot presents genes differentially expressed in cumulus cells in LEPT or in 4 wk HFD, with False Discovery Rate <0.05. Those coloured blue are down-regulated both in response to leptin treatment and 4 wk HFD; those in yellow upregulated by both treatments. Heatmaps presenting fold of change in expression of genes associated with the following pathways: (E) epigenetic regulation; (F) actin cytoskeleton organisation; (G) glucose metabolism; (H) long chain fatty acid oxidation in CC. Gene ontology analysis performed with Gene Ontology Enrichment Analysis and Visualisation Tool. log2_FC of reads per million (RPM).